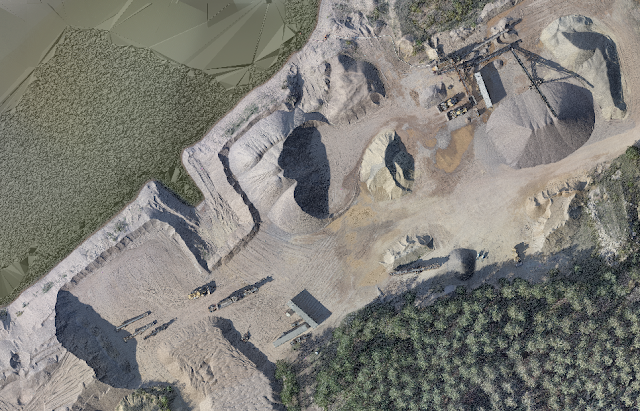
In the earlier classes, we have mostly focused on ArcGIS to process UAS data. For this lab we have instead used a popular open-based software - QGIS - to calculate the volume of piles. The descriptions of the processes will not be posted as we normally do - methods, discussion, and conclusion - but rather as captions below the images.
 |
| Figure 1: The class started by adding the Litchfield imagery and DSM to QGIS. |
 |
| Figure 2: Go to the properties and check out the image's coordinate system, which in this case has EPSG 32615. |
 |
| Figure 3: Create a hillshade. |
 |
| Figure 4: The hillshade result. |
 |
| Figure 5: Set the hillshade layer in between 70 and 75 percent transparency. |
 |
| Figure 6: Create a new shapefile and use the same coordinate system (EPSG: 32615) |
 |
| Figure 7: Choose pile and turn on the digitizing toolbar. Then create a polygon. |
 |
| Figure 8: Clip the raster (the pile). |
 |
| Figure 9: The clipped raster. |
 |
| Figure 10: Determine the base level (by identifying the elevation on the black outside of the pile) and open the Saga Raster volume tool. |
 |
| Figure 11: Choose the pile DSM as input and add the base level that was found, in this case, average 234 meters around the pile. |
 |
| Figure 12: The result of raster volume process will be posted in the view log panel. |
No comments:
Post a Comment