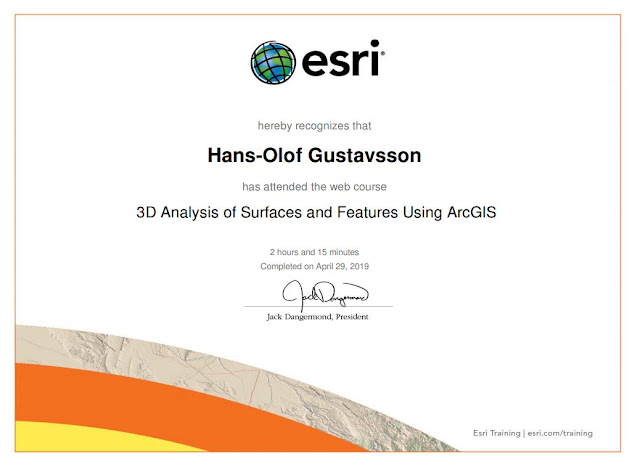
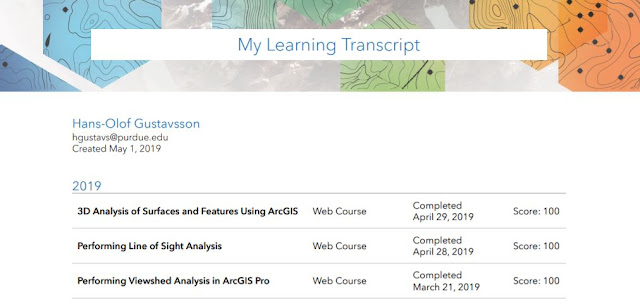
Maps are fun! This section highlights what AT319 is all about and what I have done in terms of cartography and UAS mapping. It was a very open process that let the creativity sparkle. All of these images are to be found in the posts with explanations of what and why they accomplish. Primarily I did my maps with ArcGIS Pro, but also ArcMap was used in the beginning. Pix4DMapper was used for video creation and ArcScene for some 3D-figures. Click on the images to get a better view of the work.


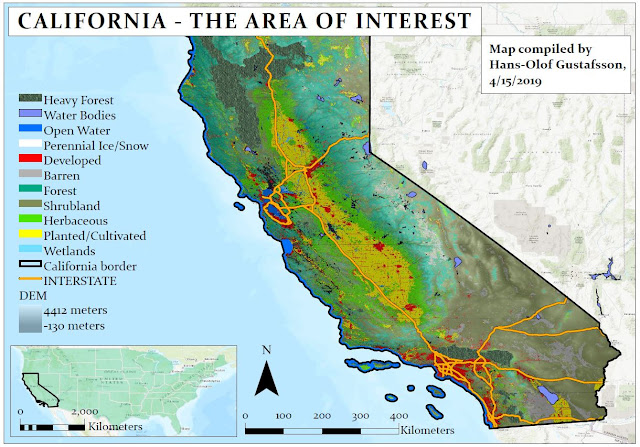 |
| Figure: Not for the course, just voluntary assignment for displaying land cover over California, together with a hillshade, based on the Digital Elevation Model I by myself generated with the "Aspect"-tool after finding and downloading the 67 separate DEM images over California at https://earthexplorer.usgs.gov |
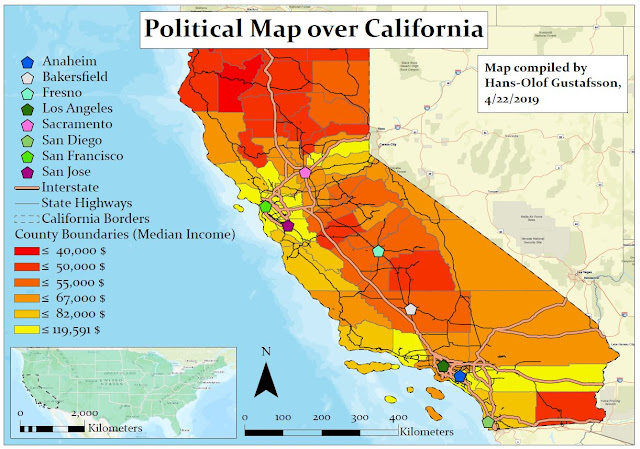 |
| Figure: Not for the course, just voluntary assignment for median income over California. Data gathered at census.gov and then joined together with a county layer. |
 |
| Figure: Not for the course, just voluntary assignment for median income over California. |
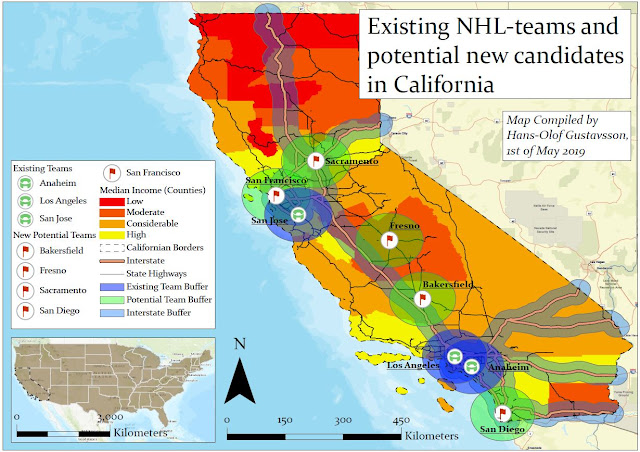 |
| Figure: Existing NHL teams and potential new candidates in California. Not for the course, just voluntary assignment for displaying median income over California. What differs this map from the one above is that this is not a shapefile that symbolize the different counties but instead a raster, which I thereafter reclassified to four classes ranging from Low to high. Also, I have buffered the Interstates with a distance of 25 kilometers. The cities are buffered with a radius of 70 kilometers. |
Figure: Me flying a UAV, the 3DR Solo Drone.
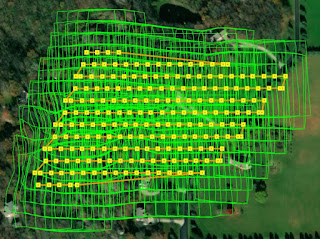 |
| Figure: After block adjustment |


No comments:
Post a Comment