Introduction
When working with a project that demands Ground Control Points (GCP), knowing how to correctly position, measure and record GCPs can make all the difference. In this update, I will delve into this topic. This week's focus lay on using the same techniques from last week but with the "small" difference of including GCPs. Also, the class was about to use images over another area, the Wolf Paving site in Wisconsin. A point cloud data set, a few maps and a video was generated. We were supposed to process our image data with the Pix4DMapper and then make maps with the generated data in ArcGIS Pro. In contrast from last week, this week the GCPs was part of the workflow.
Ground Control Points are used to georeference models while checkpoints (CPs) are used in the after-process to assess the absolute accuracy of the model. GCPs are marked targets on the ground, distributed throughout the area of interest. Ideally one should have at least 5 GCPs, preferably 10. Using more than necessary is good for quality checks. Additional GCPs can be used as checkpoints to improve both the relative and absolute accuracy. To avoid confusion, one would have to make sure the GCPs are positioned far enough apart. Generally, if one sees more than one GCP in an image, they are too close together. The GCPs coordinates are used to help Pix4DMapper accurately position the map in relation to the real world.
The quality of GCPs have an impact on the accuracy of the math model and that itself determines the result of the project. The person who is dealing with the UAS data has to rely on that the collector of the GCPs has done their work correctly. For the collector of GCPs, it helps to choose features that are possible to identify at the resolution of the raw image. He or she should choose features that are close to the ground, for example, buildings or big rocks. Then identify the features in the raw image that is wanted as GCP before collecting the actual GCP coordinates in the field. Hiring a surveyor to measure the location of the GCPs is an option. In one of the courses, I have done this myself using a handheld GPS unit. Also, it is important to collect GCPs from a variety of elevations in a broad distribution over the whole image. Preferably one spot in each corner and then one in the sweet spot of the area of interest.
Methods
The project images for this week's tasks were collected from this site, The Wolf Paving, Figure 1.
 |
| Figure 1: The site of Wolf Paving |
Some metadata, that needs to be addressed. Notice the additional information about where exactly we used to measure the GCPs, Table 1.
Table 1: Metadata. Notice the additional information
 |
| Figure 2: Nadir viewing |
Figure 3 illustrates, the preferred option is to use the Linear Rolling Shutter model, which will be displayed in Figure 4.
 |
| Figure 3: Linear Rolling Shutter model |
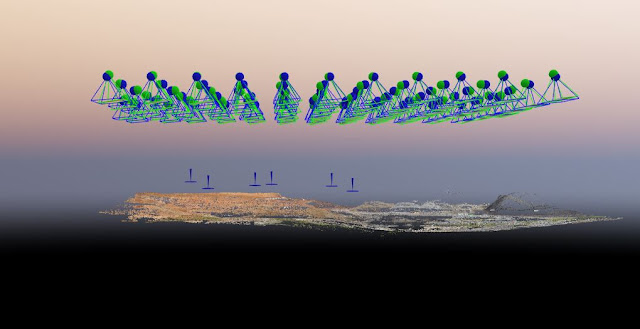
Since the GCPs (blue crosses) are clustered between the lower rows, to the pilot and decision-makers, one could argue to exclude flying the top row line. If one decides to not cut it, one run into the risk of having a bias on the sampling of GCPs and by that bringing in inaccuracies in the dataset.
 |
| Figure 4: GCPs and the flying route. |
Next step, Figure 5, was to import our GCPs from a text file. An important reminder here is to never just accept the defaults. One always have to doublecheck that the GCPs are in the same coordinate systems and use correct datum.
 |
| Figure 5: If needed, this is where one can change the GCP coordinate system. |
The text file we received from the field operator included these numbers, Figure 6. The order was not properly done, which needs to be taken care of.
 |
| Figure 6: The XYZ fields were in an incorrect order. |
Some alterations were needed for Pix4DMapper to read them correctly, which is the Northern, Eastern and Elevation. Therefore one has to switch order, Figure 7.
 |
| Figure 7: Changing the order of the values of Northern, Eastern, and Elevation. |
Figure 8 displays how the software tool looks, right after a proper change and the import of the GCPs.
 |
| Figure 8: The imported GCPs, in the correct order. |
Figure 9, 10 and 11 all display steps in the process highlight settings regarding the Point cloud and Ortho-creation. There are some features that are optional but, which in the end, can give interesting aspects of the work. Also, it is possible to create new shapefiles, ready to be used in GIS-softwares like QGIS or ArcGIS.
 |
| Figure 9: Resolution and point cloud options. |
 |
| Figure 10: Digital Surface Model and Orthomosaic options. |
 |
| Figure 11: Additional outputs. |
Below, Figure 12, one discovers there is an offset between the GCPs (blue vertical lines) and the ground. Since the GCPs are floating in space the Pix4D will have to bring the UAV data to reality. These errors often occur because they are done in a different datum.
 |
| Figure 12: Offset between the GCPs and the ground. |
Working with GCPs are not always easy since misplacements of them occur, which will reduce the accuracy later on in the project. In order to facilitate this work and properly see the GCPs distribution, it is a good idea to open an ArcMap project with the same GCPs. Figure 13 and 14 displays this procedure.
 |
| Figure 13: Work side by side between Pix4DMapper and ArcMap. |
 |
| Figure 14: A way to doublecheck where the markers are is to use ArcMap on the side. |
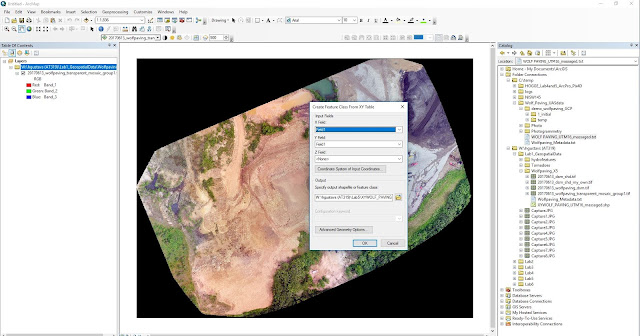
Also working with ArcMap one has to consider the actual coordinate system. As Figure 15 shows, the projected coordinate system was WGS84 UTM 16N. Be aware of the metadata file to see the orders of the fields, some alterations were needed here.
 |
| Figure 15: Choose the correct coordinate system. |
After these steps, in Figure 16, ArcMap displays the GCPs in green. It is good to use the Identifier-tool, so one knows which one is which.
 |
| Figure 16: GCPs in green and the Identifier-tool. |
Below in Figure 17, the Identifier-tool gives us the value for point 101.
 |
| Figure 17: Data for point 101. |
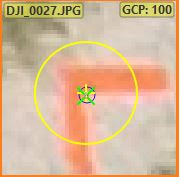
Ater the correct GCPs are identified, we are going back to work in Pix4DMapper. Below in Figure 18, is the initial difference between the chevron (the red marker up left) and the GCP-data (blue dot in the bottom right). In the next step, this is something which is going to be altered for all GCPs.
 |
| Figure 18: Difference between the marker and one GCP. |
Right after the GCP data has changed it looks like in Figure 19. Also, according to field operators, always go on the inside of the chevron. Dropping this phase can weaken the quality significantly, especially in areas where high elevation variances occur. This is important information and should go into the metadata.
 |
| Figure 19: Be meticulous when deciding correlation points. |
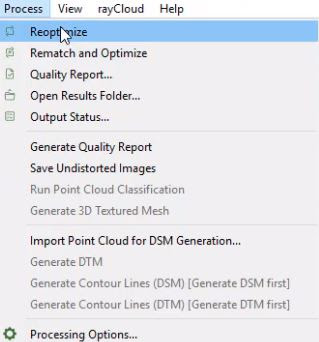
After these changes and the GCPs are brought down to the ground, the imagery has to recalibrate itself to where those GCPs are now. This is done in a re-optimization process, shown in Figure 20.
 |
| Figure 20: Re-optimization |
As mentioned before, the GCPs were brought down to the correct location on the ground and after that, we did a re-optimization. Figure 21 displays the result of this process. Now it is time to create the Point cloud, the Digital Surface Model and the Orthomosaic. This process takes a while.
Welcome back! In Figure 22, it is possible to see the GCP marks and the cloud matching one another in the mesh of the Point cloud data.
 |
| Figure 22: The result of the images has been processed. |
Figure 23, displays that the GCPs match up with the ground surface.
 |
| Figure 23: This is where I chose the GCP to be for Point 101 earlier. |
As illustrated below in Figure 24, the GCPs are on the ground and the DSM and Ortho are created.
 |
| Figure 24: Final product ready to be used for other purposes. |
This is a better angle to illustrate the above mentioned regarding the GCPs, Figure 25.
 |
| Figure 25: The ground welcomes the GCPs. |
Results and Discussion
Below is the video I created with Pix4DMapper, Video 1. This time the video includes Ground Control Points.
Video 1: My video, created with Pix4DMapper includes GCPs.
Instead of using ArcScene this time to create a 3D version of the place I chose to use the 3D report we chose to create earlier from Pix4DMapper. See Figure 26 below, a meshed version of the site was created.
 |
| Figure 26: Results from the 3D report. |
My goal was to create maps that showed both the GCPs and the elevation data in an appealing way. Both for the Orthomosaic and the Digital Surface Model, with the latter as the biggest challenge, Figure 27.
 |
| Figure 27: Digital Surface Model, with interposed visuals from Pix4DMapper. |
Figure 28, this week's orthomosaic illustrates the details in better quality than last weeks. Using GCP's has an impact on the quality, however, I do not really know the impact the different sensors play here. This week's images were taken with Zenmuse X5 while last week's imagery was taken by an E90.
 |
| Figure 28: This week's map has higher accuracy and greater |
Last week's results are shown below in Figure 29.
 |
| Figure 29: Last week's map |
In Figure 30, just to illustrate that pattern, even when zooming in to the exact same scale as last week, the same conclusion is met. With the usage of GCPs, the accuracy increase and has an impact on the quality. An important note is that the usage of GCP does not automatically improve the quality.
 |
| Figure 30: This week's map, zoomed in. |
Conclusion
GCPs are a vital tool for precision mapping, but the majority of UAV maps do not require GCPs. In order to save money and time, it is of importance to understand when to use GCPs and when to skip them. In general, if the specific project requires a high degree of global accuracy one should use GCPs. This is important when orthorectifying the map.
Since a high level of global accuracy is important for surveyors, they usually use GCPs. For instance in property boundary surveys. Occasions, when GCPs are not necessary could, for instance, be when one uses a map to take volumetric or linear measurements within a map to measure the stockpile volumes or the length of a fence.
A conclusion is that GCPs may not always do much to increase the quality of the measurements, but either way, they are useful to prove that the measurements are accurate. There is a positive correlation between high-resolution images and stitching accuracy. Thus, as long as the resolution of a map is good, the margins of errors for measurements are going to be the same with or without the use of GCPs.
When Pix4DMapper processes imagery into a map, it uses camera GPS information on the images. The quality of a map is statistically expressed as the average error between where the GPS said the camera was and where Pix4DMapper calculates the camera needed to be in order to make the overlapping images stitched together into a map.
In contrast to last week's report when we worked without GCPs, this week really got us some statistical numbers to examine. There are a great number of statistical numbers to compare accuracy in the report. The internal orientation that regards the camera and external that also take the camera positioning into account. I would focus on the Root Mean Square Error (RMSE). The X,Y and Z values that refer to the RMSE for all of the individual cameras in the X, Y or Z directions and the total RMSE are the errors across all three different directions.
GSD (Ground Sample Distance) refers to the number of pixels per centimeter. The higher the number of pixels per centimeter, the greater the accuracy of the map. The report gave me the value of 1 x GSD (2.09 [cm/pixel]) for the DSM and Orthomosaic Resolution. That is the equivalent of 2.09 cm of accuracy.
Processing time
In Table 2, last week's orthomosaic generation, without GCPs, took about 30 minutes.
 |
| Table 2 Last week's orthomosaic generation, without GCPs, took about 30 minutes. |
As Table 3 displays, this week's processing an orthomosaic took just below 15 minutes.
 |
| Table 3: This week's orthomosaic, with GCPs. Processing time stopped just below 15 minutes. |
Quality in terms of accuracy
Relative Accuracy is generally for projects like taking small-scale measurements, visual inspections, and monitoring stuff. Absolute accuracy becomes important when you need a high degree of confidence that the latitudinal, longitudinal and elevation measurements are correct. The Relative accuracy is as follows from Table 4 below. The Absolute accuracy was according to Pix4DMapper like presented in Table 5. As a rule of thumb, the elevation accuracy of a map will be around 3 times worse than its horizontal peers.
Not sure how important this statistical measure is when it comes to quality reporting but Table 6 and 7 displays the relative vs absolute uncertainties respectively.
 |
| Table 6: Relative camera position and orientation uncertainties |
Absolute XYZ uncertainties are at about 7 cm, 6 cm, and 14 cm respectively.
 |
| Table 7: Absolute camera position and orientation uncertainties |
 |
| Table 8: All 69 images were enabled and calibrated. Accuracy landed on 2.9 centimeters. |


